For high-earning corporate executives, technology professionals with complex equity compensation, business owners, and non-resident professionals, multi-crore targets like ₹10 Crore, ₹25 Crore, or ₹50 Crore are frequently framed as simple mathematical milestones. Retail financial media routinely suggests that achieving these goals is merely a matter of plugging numbers into a standard Systematic Investment Plan (SIP) calculator, choosing a generic mutual fund, and assuming a flat, uninterrupted annualized return.
In reality, institutional-quality wealth creation is a multi-decade engineering problem. Simplistic, calculator-driven models consistently fail because they ignore the real-world friction points that destroy capital: structural lifestyle inflation, purchasing power erosion, tax drag, Sequence of Returns Risk (SRR), and behavioral volatility. This blueprint moves past motivational narratives and simplistic assumptions to outline the exact architectural principles required to systematically build, optimize, and preserve large-scale financial corpuses across shifting macroeconomic cycles.
Redefining What a Multi-Crore Corpus Actually Means
The initial point of failure in long-term financial planning is treating wealth as a static nominal number. A corpus target that appears vast today will have its real-world economic utility dramatically reshaped over a 15, 20, or 30-year compounding horizon due to the compounding effects of structural inflation.
| Nominal Corpus Target | Real Purchasing Power (10 Years) | Real Purchasing Power (20 Years) | Real Purchasing Power (30 Years) |
|---|---|---|---|
| ₹10.00 Crore | ₹5.58 Crore | ₹3.11 Crore | ₹1.74 Crore |
| ₹25.00 Crore | ₹13.96 Crore | ₹7.79 Crore | ₹4.35 Crore |
| ₹50.00 Crore | ₹27.91 Crore | ₹15.58 Crore | ₹8.69 Crore |
Note: Values are calculated assuming a baseline structural inflation rate of 6% per annum.
When lifestyle inflation—the real-world cost escalation of healthcare, global education, and premium urban living—is factored in, the true inflation rate for affluent households often hovers between 7% and 8%. Consequently, a long-term strategy must optimize for real, net-of-inflation, post-tax returns rather than nominal yields. If your portfolio layout does not account for this erosion, you are tracking a mathematical illusion that will leave you undercapitalized.
Wealth Creation Is Primarily a Systems Problem
The standard retail investing narrative encourages a heavy focus on micro-level tactics: hunting for "multibagger" small-cap stocks, trying to time market corrections, or continuously rotating between trending mutual funds. Empirically, these actions add friction, generate tax drag, and introduce unhedged risks.
Elite wealth creation is a structural systems problem. Long-term compounding velocity is driven by variables that are entirely within the investor's control: your savings rate, your baseline time horizon, your strategic asset allocation matrix, and your behavioral consistency. Market selection and security picking contribute a fraction of long-term performance variance compared to these foundational structural pillars. Moving from an active income stream to a multi-crore asset base requires building a reliable system that removes emotional decision-making from capital deployment.

The Mathematics of Compounding: The 4 Major Variables
To build an institutional-grade wealth engine, you must understand how the core variables of a financial plan interact over time. Each variable serves a specific mechanical purpose at different stages of the accumulation lifecycle.
| Core Variable | Structural Mechanical Purview | Systemic Leverage Level |
|---|---|---|
| Savings Rate | The absolute fuel of the wealth engine; provides early-stage compounding velocity. | Highest impact in Years 1–10 of corpus construction. |
| Time Horizon | The exponential multiplier; accelerates the compounding curve non-linearly. | Highest impact in Years 15–30 of the portfolio lifecycle. |
| Asset Allocation | Manages risk-adjusted variance; defines the portfolio's structural boundaries. | Critical across all phases to prevent catastrophic drawdowns. |
| Return Rate (CAGR) | The portfolio's baseline yield engine over long horizons. | Important, but highly overestimated by retail investors. |
Time Horizon Scenarios: The Cost of Delay
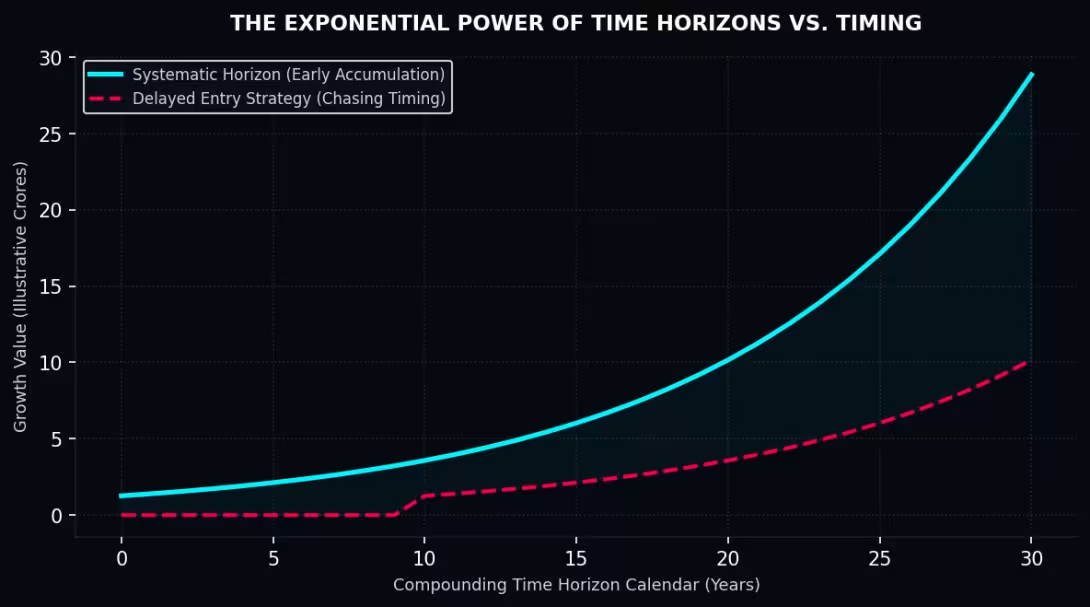
The table below outlines the illustrative monthly investments required to accumulate a nominal target of ₹10 Crore across different time horizons, assuming a standardized, diversified market return expectation of 11% per annum.
| Compounding Time Horizon | Illustrative Required Monthly Capital Outlay | Total Capital Deployed Over Horizon | Total Yield Generated by Compounding |
|---|---|---|---|
| 10-Year Horizon Path | ₹435,000 / month | ₹5.22 Crore | ₹4.78 Crore |
| 15-Year Horizon Path | ₹218,000 / month | ₹3.92 Crore | ₹6.08 Crore |
| 20-Year Horizon Path | ₹115,000 / month | ₹2.76 Crore | ₹7.24 Crore |
| 25-Year Horizon Path | ₹62,500 / month | ₹1.87 Crore | ₹8.13 Crore |
| 30-Year Horizon Path | ₹35,000 / month | ₹1.26 Crore | ₹8.74 Crore |
This data highlights the non-linear cost of delaying your investments. Shortening your timeline from 20 years to 10 years doesn't simply double your required monthly savings—it increases the monthly capital requirement by nearly four times. Delaying action severely compromises the performance of your compounding engine, forcing you to rely on massive, high-stress active cash contributions later in life.
The ₹10 Crore Corpus Strategy: The Engine Optimization
The ₹10 Crore milestone is typically targeted by senior technology professionals, dual-income corporate executive households, and successful corporate entrepreneurs. At this accumulation stage, the strategy focuses on maximizing your active savings rate and building an uncompromised, growth-oriented equity footprint.
Suggested Strategic Asset Allocation Models
| Asset Classification Class | Aggressive Accumulator Profile Allocation | Moderate Builder Profile Allocation |
|---|---|---|
| Indian Equities (Large, Mid, Flexi-Cap) | 50% Allocation Block | 40% Allocation Block |
| International Equities (US Index / Global) | 20% Allocation Block | 15% Allocation Block |
| Fixed Income, Short-Duration Debt & Arbitrage | 15% Allocation Block | 25% Allocation Block |
| Alternative Assets (REITs, InvITs, Curated Vectors) | 10% Allocation Block | 15% Allocation Block |
| Sovereign Gold / Liquid Cash Reserves | 5% Allocation Block | 15% Allocation Block |
The aggressive variation focuses heavily on capturing market premiums by allocating 70% of the portfolio to global equities. This strategy uses international equity allocations to provide a structural currency hedge against long-term INR depreciation. The 15% allocation to fixed income acts as tactical dry powder, allowing you to rebalance into equities at a discount during major market corrections.
The ₹25 Crore Corpus Strategy: The Optimization Shift
Transitioning a portfolio toward a target of ₹25 Crore requires shifting your focus from pure wealth accumulation to sophisticated wealth optimization and risk mitigation. At this level, managing your income scaling velocity becomes far more impactful than trying to force marginal outperformance from your investment yields.
For professionals holding concentrated wealth in corporate ESOPs, managing concentration risk becomes an absolute priority. A portfolio that is heavily exposed to a single corporate entity leaves your family’s balance sheet vulnerable to sudden sector shocks or company-specific drawdowns.
To protect your capital, you must implement a structured diversification strategy: systematically liquidating vested stock options within regulatory limits, optimizing your capital gains tax liabilities, and reallocating the proceeds into a diversified multi-asset framework. This approach ensures your wealth is insulated from concentrated equity downside while continuing to compound securely.
The ₹50 Crore Corpus Strategy: Family-Office Style Governance
Managing a corpus target of ₹50 Crore shifts your portfolio into the ultra-HNI and multi-generational family office territory. At this scale, the primary objectives naturally evolve from wealth accumulation to long-term wealth preservation, tax isolation, and structural legacy planning.
Strategic Investment Priorities By Corpus Scale
| Corpus Milestone Stage | Primary Operational Focus Area | Core Risk-Mitigation Layer |
|---|---|---|
| ₹10 Crore Milestone | Aggressive Core Accumulation | Savings Velocity & Global Indices Alignment |
| ₹25 Crore Milestone | Portfolio Optimization Shield | ESOP De-risking & Asset Location Tax Matching |
| ₹50 Crore Milestone | Preservation & Legacy Transmission | Institutional AIFs, Private Trusts & Estate Protection |
The Strategic Multi-Bucket Asset Segregation Matrix
| Portfolio Segment Bucket | Primary Strategic Purview | Permitted Institutional Instruments |
|---|---|---|
| Bucket 1: Growth Capital | Beating real structural inflation; multi-generational wealth compounding. | Direct Equities, PMS, Category I/II Alternative Investment Funds (AIFs). |
| Bucket 2: Income Capital | Securing reliable cash flows to support active lifestyle requirements. | Maturity-Laddered Debt Arrays, Target Maturity Funds, Sovereign Bonds. |
| Bucket 3: Opportunistic Capital | Tactical, valuation-driven deployment during severe market corrections. | Liquid Funds, Treasury Bills, High-Liquidity Arbitrage Tracks. |
| Bucket 4: Legacy Capital | Isolated, frictionless inter-generational wealth transfer. | Private Family Trusts, Compliant Estate Distribution Matrices. |
At this level, you can expand your asset allocation into sophisticated, institutional alternative instruments. Allocating 15% to 25% of the portfolio to private equity pools, venture credit structures, venture capital funds, and structured products provides access to uncorrelated alpha streams that are completely decoupled from volatile secondary public markets. This institutional structure shields your family legacy from broader market volatility.
The Required Savings Rate Framework
The table below highlights how your active savings rate directly dictates your long-term wealth creation trajectory, moving you across different compounding velocities.
| Baseline Savings Rate Bracket | Long-Term Compounding Trajectory Profile | Approximate Time Horizon to Early Financial Freedom |
|---|---|---|
| 10% – 15% Savings Rate | Slow, baseline compounding; highly vulnerable to unexpected lifestyle inflation shocks. | 28 – 35 Years of uninterrupted professional execution. |
| 20% – 30% Savings Rate | Strong long-term growth trajectory; forms a reliable mass-affluent foundation. | 20 – 25 Years of consistent system execution. |
| 40%+ Savings Rate | Accelerated wealth engineering; rapidly builds multi-crore capital independence. | 12 – 15 Years of optimized professional lifestyle execution. |
Increasing your core earning capacity through professional scaling, executive growth, or corporate optimization consistently builds long-term wealth faster than trying to outperform the market. Finding ways to systematically optimize your cash flow and increase your active monthly savings contribution will do far more to shorten your timeline to financial freedom than continually switching mutual funds or adjusting micro-tactics inside a sub-optimal portfolio.
Long-Term Expected Return Assumptions and Sequence Risk
To build a reliable long-term financial plan, your strategy must look past the inflated, short-term returns of recent market rallies. Institutional wealth planning uses realistic, long-term capital market return assumptions across major asset classes:
- Indian Equities (Domestic Basket): 11.0% – 13.0% annualized yield.
- International Equities (Global Basket): 8.0% – 11.0% annualized yield.
- Fixed Income & High-Quality Debt: 6.0% – 8.0% annualized yield.
- Sovereign Gold / Alternative Anchorage: 5.0% – 7.0% annualized yield.
The Hidden Risk: Sequence of Returns Risk (SRR)
Relying on an average annual return calculation introduces a major structural vulnerability known as Sequence of Returns Risk. The timing of market drawdowns can fundamentally alter your portfolio's long-term viability, even if your average returns match your initial projections over time.
If a portfolio experiences a severe bear market or prolonged economic correction during the initial years of its withdrawal phase, the investor is forced to liquidate fracturing equity assets at a steep discount to meet real-world lifestyle expenses. This permanently cannibalizes the portfolio's underlying unit base, severely damaging its capacity to recover and compound during the next market upcycle.
To insulate your capital from this structural risk, your strategy must utilize tactical asset allocation adjustments, maintain multi-year cash flow runways, and implement a strict framework to guarantee your lifestyle needs are covered without ever forcing a sale of equity assets during a market downturn.
Risk Management Framework: Mapping Structural Liabilities
Building multi-crore portfolios requires managing threats across your entire personal balance sheet. A comprehensive risk management framework evaluates exposures across seven distinct vectors:
- Market Risk: Mitigated through systematic asset rebalancing based on trailing valuation parameters.
- Liquidity Risk: Addressed by matching your assets directly to your liabilities and maintaining clear short-term cash flow runways.
- Concentration Risk: Handled by systematically unwinding outsized individual stock positions, real estate holdings, or legacy business stakes.
- Behavioral Risk: Managed by automating your investment processes and routing capital through a fiduciary advisory framework to eliminate emotional decision-making.
- Leverage Risk: Controlled by keeping your portfolio entirely free from speculative margin debt or high-interest unsecured liabilities.
- Currency Risk: Insulated by maintaining structural allocations inside hard offshore assets and global index tracks to protect purchasing power.
- Career Risk: Addressed by establishing large liquidity reserves if your primary income stream is heavily tied to cyclical industries, corporate startups, or concentrated equity compensation fields (ESOPs).
Dynamic Asset Allocation Models
An institutional-grade portfolio matrix must match your professional life stage and specific career risks. The table below outlines how strategic allocations adapt across five distinct investor profiles:
| Investor Profile Archetype | Domestic Equity | Global Equity | Fixed Income | Alternatives / Gold |
|---|---|---|---|---|
| Early Career Accumulator | 60% Allocation | 20% Allocation | 10% Allocation | 10% Allocation |
| Mid-Career Wealth Builder | 50% Allocation | 15% Allocation | 20% Allocation | 15% Allocation |
| Pre-Retirement Multi-Crore Builder | 35% Allocation | 10% Allocation | 40% Allocation | 15% Allocation |
| Corporate Entrepreneur Matrix | 30% Allocation | 20% Allocation | 30% Allocation | 20% Allocation |
| Global NRI Asset Explorer | 40% Allocation | 30% Allocation | 15% Allocation | 15% Allocation |
Behavioral Finance: The True Cost of Portfolio Friction
The ultimate success of a multi-decade financial plan depends far more on managing investor psychology than optimizing micro-level math. Long-term compounding value is consistently destroyed by predictable behavioral traps: panic selling during standard market corrections, chasing returns due to Fear of Missing Out (FOMO), or suffering from overconfidence bias during extended bull markets.
Successful wealth accumulation over long horizons is systematically boring. It requires executing predefined strategies with absolute discipline, turning off short-term financial news, and ignoring speculative trends. Portfolios that undergo continuous modification, tactical stock switching, or emotional timing adjustments inevitably underperform simple, uncompromised, systematically rebalanced index allocations.
Tax-Efficient Wealth Compounding and Asset Location
For high-net-worth portfolios, taxes are often the single largest drag on performance. Maximizing your long-term compounding velocity requires implementing an intelligent Asset Location Strategy—deliberately placing specific asset classes into the most tax-efficient account structures available.
High-turnover, tax-inefficient components—such as credit risk funds, short-duration corporate debt, or high-yield dividend stocks—should be placed inside tax-insulated or tax-deferred vehicles whenever possible. Conversely, long-term, tax-efficient investments like core equities should be located in direct, tax-optimized brokerage frameworks to capture long-term capital gains (LTCG) tax benefits.
By structuring your asset locations cleanly, keeping trading turnover low, and implementing systematic tax harvesting strategies within regulatory limits, you can significantly reduce your annual tax drag and keep more of your capital compounding efficiently over time.
Strategic vs. Tactical Asset Allocation
A multi-crore investment strategy separates asset allocation into two distinct operational layers:
- Strategic Asset Allocation (SAA): This forms your core structural baseline. It defines the permanent, long-term asset class weights (e.g., a 60/40 Equity/Debt split) tailored explicitly to your family's baseline risk tolerance, multi-decade time horizons, and core financial milestones.
- Tactical Asset Allocation (TAA): This serves as your short-term operational overlay. It introduces temporary, valuation-driven adjustments to your baseline allocations—such as trimming equity allocations when broad market valuations hit historic extremes, or deploying liquid cash reserves to purchase high-quality assets when deep market corrections occur.
Nine Fatal Mistakes Chasers of Large Wealth Commit
Through our fiduciary advisory practice, we consistently identify nine critical errors that destroy long-term compounding outcomes for affluent families:
- Projecting linear portfolio growth based on unrealistic, short-term historical returns.
- Utilizing margin debt or excessive leverage to chase aggressive performance targets.
- Concentrating wealth in high-risk stock bets, localized real estate, or unhedged sector allocations.
- Underinsuring foundational liabilities, exposing long-term investment portfolios to sudden liquidity shocks.
- Failing to maintain separate emergency cash reserves, forcing an untimely liquidation of equity assets during market downturns.
- Relying on nominal targets without indexing their actual future purchasing power against inflation.
- Ignoring annual tax drag and failing to optimize for net-of-tax returns across accounts.
- Continuously altering portfolios, rotating funds, and chasing short-term performance trends.
- Allowing lifestyle creep to expand faster than income growth, capping their active savings rate.
Wealth Creation Across Life Stages
Your wealth engineering system must adapt as you move through your professional lifecycle:
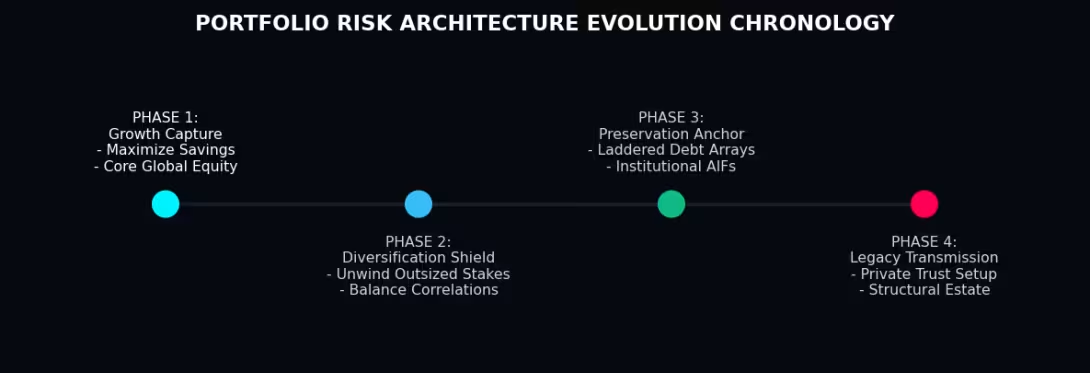
- The Accumulation Phase (Age 25–35): Focuses entirely on maximizing your savings rate and building an aggressive global equity footprint. At this stage, you should maintain low lifestyle overhead and automate your deployment pipelines completely.
- The Acceleration Phase (Age 35–45): This phase leverages peak active earning capacity. The focus shifts to managing concentration risk (such as corporate ESOPs), scaling your monthly investment volumes, and optimizing your tax structures.
- The Optimization Phase (Age 45–55): Focuses on balancing growth with stability. At this milestone, you begin implementing systematic maturity laddering across debt portfolios and securing independent income streams to immunize your lifestyle expenses from market corrections.
- The Preservation Phase (Age 55+): Focuses on multi-generational wealth transfer and sustainable legacy structuring. The primary priorities become establishing robust estate plans and managing your distribution sequences efficiently.
What Multi-Crore Investors Do Differently
Affluent investors who successfully scale and preserve large fortunes operate with a distinct structural mindset. They treat wealth creation as an institutional process rather than a series of disconnected transactions.
Instead of chasing short-term performance or hunting for exotic products, they focus on absolute savings discipline, maintain decades-long investment horizons, and ensure deep diversification across non-correlating global asset classes. They view volatility as a normal mechanical function of public markets rather than a source of panic, manage their portfolios on a strict post-tax basis, and utilize transparent, fiduciary advice to protect their time and insulate their capital from structural risks.
Realistic Strategic Wealth Case Studies
Achieving multi-crore targets is possible through multiple distinct professional paths:
- The Salaried Corporate Professional: Reaches their goals by maintaining a steady, disciplined 45% savings rate over a 25-year career, utilizing automated monthly investment flows to capture global market indices, and using a fee-only advisor to rebalance their portfolio systematically.
- The Startup Employee with ESOPs: Reaches their milestone by treating equity compensation with absolute risk awareness—systematically liquidating company options upon vesting to diversify their wealth out of concentration risk and build a balanced global portfolio.
- The Corporate Entrepreneur Matrix: Achieves their objectives by deliberately separating their personal wealth from their business balance sheet, ensuring their personal assets are insulated from corporate liabilities and deployed into independent, liquid financial instruments.
Moving Beyond CAGR: Stochastic Scenario Analysis
Relying on a single, fixed annualized return assumption to plan your financial future introduces significant structural risk. Real-world financial planning avoids static metrics and utilizes Stochastic Scenario Analysis (Monte Carlo Modeling) to evaluate portfolio sustainability.
By simulating thousands of potential market paths—incorporating variable inflation spikes, severe bear markets, and shifting asset correlations—this framework generates true probability ranges for your long-term success. This systems-driven approach lets you stress-test your portfolio against extreme economic environments, helping you design a wealth architecture that is built to survive real-world volatility.
The Role of a SEBI Registered Investment Adviser (RIA)
Building and optimization a multi-crore portfolio requires balancing complex tax rules, legal boundaries, asset allocations, and behavioral management simultaneously. At Wealth Together, our fee-only fiduciary advisory framework completely removes product commissions and distribution incentives, ensuring our guidance remains entirely objective and aligned with your long-term financial security.
We help you look past short-term market noise and simple calculators to design a resilient wealth architecture built to preserve and multiply your family legacy across generations.
We invite you to explore our comprehensive Get Started Onboarding Roadmap to learn about our international diagnostic workflows, or use our secure portal gateway to schedule your private, zero-obligation cross-border strategy consultation today.
Skip commission-driven sales pitches and align your capital with a pure fee-only fiduciary adviser.