In the landscape of Indian wealth management, structural convenience often masks a subtle but destructive financial flaw. For years, affluent families have relied on traditional regular mutual fund structures, under the comfortable impression that the platform interfaces, tracking tools, and relationship interactions they receive are entirely free. This is a massive, multi-million rupee misconception.
Most investors can easily state their monthly investment amounts, the names of their funds, and the current value of their portfolios. Yet, very few can identify their exact expense ratios, the net difference between direct and regular options, or the total lifetime impact of embedded distribution fees. Regular mutual funds are intentionally engineered to feature embedded, continuous sales incentives called trail commissions. These fees are quietly subtracted directly from your asset pool's daily Net Asset Value (NAV) calculations by the asset management company, entirely invisible on your contract notes or account statements, and routed directly to the intermediary who sold you the product.
Understanding Direct and Regular Mutual Funds
To evaluate your portfolio objectively, you must recognize that the underlying machinery of the investment is often completely identical. Whether you hold a direct plan or a regular plan, you are getting the exact same fund manager, the exact same underlying equity holdings, the same risk framework, and the same core market strategy. The entire variance boils down to the cost structure:
| Portfolio Feature Set | Direct Mutual Fund Option | Regular Mutual Fund Option |
|---|---|---|
| Fund Manager Allocation | Identical | Identical |
| Underlying Portfolio Securities | Identical | Identical |
| Net Asset Value (NAV) Level | Higher Over Time | Lower Over Time |
| Total Expense Ratio (TER) | Noticeably Lower | Significantly Higher |
| Embedded Intermediary Commission | Absolute Zero | Yes (Continuous Trail Payouts) |
Where Does the Extra Cost Actually Go?
The extra fee loaded into regular plans is not an administrative processing cost. It is a distribution commission paid out automatically to brokers, commercial banks, traditional wealth management firms, and national distributors. From a fiduciary perspective, commissions do not automatically make an intermediary a bad actor. However, as an investor, you must evaluate whether the simple act of executing a transaction justifies an ongoing, lifetime commission fee that drains your principal wealth every single day.
Across the current market landscape, active equity funds carry an expense ratio difference ranging from 0.40% to 1.10% per year, with the realistic market average sitting at approximately 0.80%. While a 0.80% annual friction point might seem trivial on a single-page report, it forms a massive wealth leakage when allowed to compound negatively over decades against an expanding capital base.
Empirical Simulations: The Multi-Decade Wealth Leakage
To understand how an average 0.80% commission difference damages a portfolio, let us look at a standard mathematical model of a fixed 10,000 monthly Systematic Investment Plan (SIP). We will project the growth curves assuming a gross market return of 12% per annum. Stripping out a 0.8% direct cost leaves a net return of 11.2% for the Direct plan, while a 1.6% regular cost drags the Regular plan's net return down to 10.4%:
| Time Horizon Timeline | Cumulative Capital Invested | Regular Plan Value (10.4% Net) | Direct Plan Value (11.2% Net) | Wealth Consumed by Commissions |
|---|---|---|---|---|
| 10 Years | 12,0,000 | 21.2 Lakhs | 22.2 Lakhs | 1,01,162 |
| 20 Years | 24,0,000 | 81.3 Lakhs | 90.2 Lakhs | 8,90,754 |
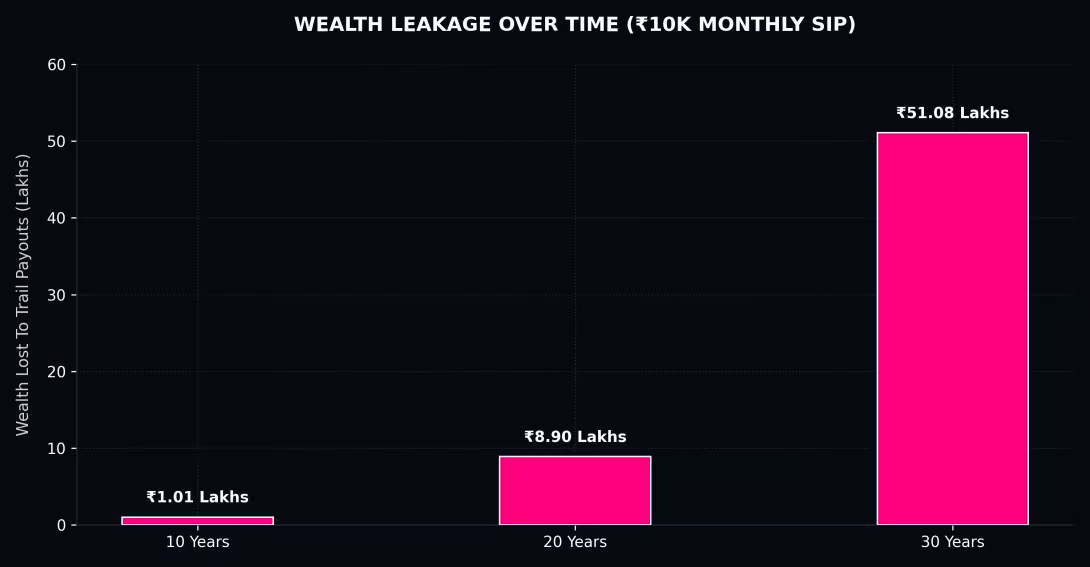
| 30 Years | 36,0,000 | 2.52 Crores | 3.03 Crores | 51,08,311 |
In the short run, the wealth leakage feels manageable at roughly 1.01 Lakhs. However, because compounding returns operate on an exponential curve, that minor cost difference creates a staggering 51.08 Lakh deficit by Year 30. That is over 51 Lakhs of hard-earned family savings diverted away from your core objectives simply to fund a product distribution loop.
The Impact of Scale: When Wealth and Income Increase
For high-income professionals and High-Net-Worth Individuals (HNIs), this leakage scales up dramatically. When you increase your investment volume to match a growing surplus, the absolute wealth lost to trail commissions turns into a massive financial anchor:
| Monthly SIP Volume Option | 30-Year Direct Value (11.2%) | 30-Year Regular Value (10.4%) | Total Lifetime Commission Penalty |
|---|---|---|---|
| 20,000 / Month | 6.06 Crores | 5.04 Crores | 1.02 Crores |
| 50,000 / Month | 15.15 Crores | 12.60 Crores | 2.55 Crores |
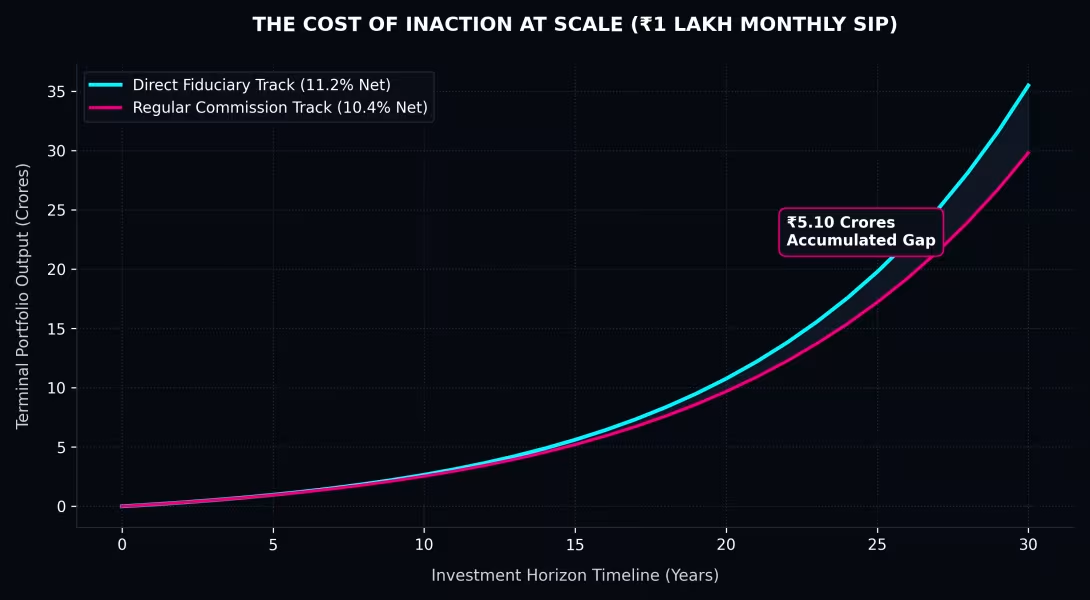
| 1,00,000 / Month | 30.30 Crores | 25.20 Crores | 5.10 Crores |
When look at these numbers at an institutional scale, a professional or executive investing 1 Lakh monthly over a 30-year career window hands over 5.10 Crores in automatic, un-vouched trail payouts to an intermediary, purely for transactional access. This is capital that never gets to perform for your family.
Real-World Asset Data Validation
This cost difference is visible across major asset classes in the Indian market today. Let us look at the documented Total Expense Ratios (TER) across prominent fund categories:
- Active Large-Cap Funds: Regular plans routinely carry a cost structure of 1.65%, while direct plans feature a TER of roughly 0.85%, locking in a structural 0.80% annual gap.
- Active Flexi-Cap / Mid-Cap Pools: High-demand active structures often push regular costs up to 1.85%, while direct variations remain optimized at 0.95%, creating a 0.90% annual drag.
- Low-Cost Index Funds: Even inside passive market trackers, regular plans load distribution fees that can widen the expense margin by 0.30% to 0.50% over pure direct options.
- Equity Linked Savings Schemes (ELSS): Tax-saving portfolios carrying a mandatory 3-year lock-in often carry regular expense ratios near 1.70%, while direct routes operate below 0.85%.
Are You Actually Receiving Proportional Value?
Instead of declaring that regular plans are inherently flawed, ask an objective question: Is the service you receive from a distributor worth the ongoing commission fees being deducted from your assets? Traditional distribution networks provide basic transactional onboarding, administrative paperwork support, and platform access. However, because their compensation is directly linked to product sales and transaction volume, their business model contains a structural conflict of interest. They face financial incentives to keep you inside higher-cost active portfolios rather than suggesting low-cost passive options, meaning you are essentially funding a sales framework that can act against your long-term wealth optimization loops.
The Solution: Shifting to the Direct Plan + SEBI RIA Model
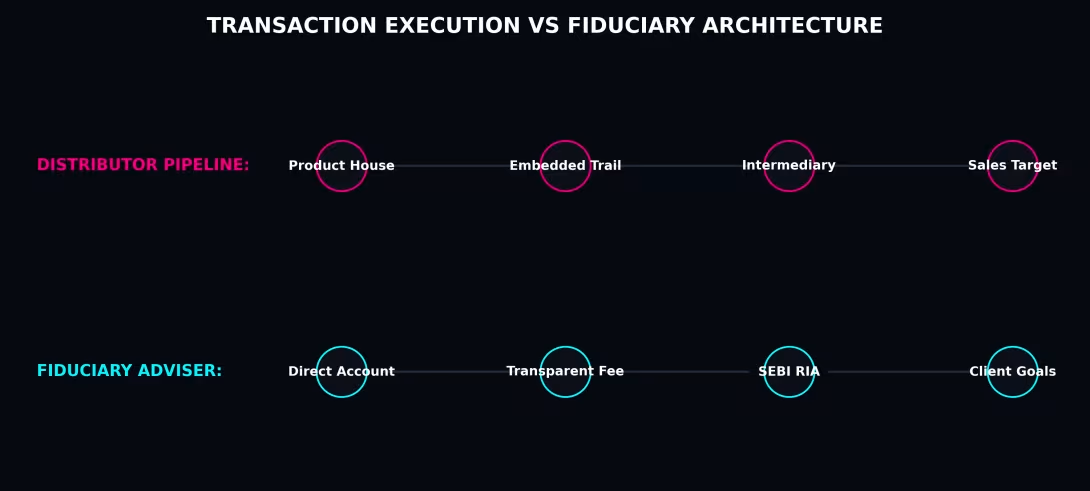
Cost reduction alone should never be your primary financial goal. True financial security requires replacing conflict-heavy distribution channels with comprehensive, transparent financial planning. Moving away from regular plans allows you to eliminate embedded commission friction and reallocate those savings into an independent, fee-only relationship with a SEBI Registered Investment Adviser (RIA). This model separates product execution from objective advice:
| Strategic Wealth Component | Traditional Product Distributor | Independent SEBI Registered RIA |
|---|---|---|
| Product Transaction Execution | Yes | Yes (Via Direct, Clean Channels) |
| Comprehensive Life Goal Planning | Limited / Product-Centric | Yes (Central Core Objective) |
| Regulatory Risk Profiling Audits | Minimal Retail Matching | Yes (Mandatory Statutory Compliance) |
| Dynamic Asset Allocation Design | Limited / Product-Heavy | Yes (Completely Product-Neutral) |
| Tax Location Strategy & Harvesting | Usually No | Yes (Comprehensive Plan Optimization) |
| Unbiased Insurance Gap Analysis | No (Driven by Commission Payouts) | Yes (Pure, Non-Commission Term Audits) |
| Inflation-Adjusted Retirement Maps | Usually No | Yes (Multi-Bucket Cash Flow Models) |
| Cross-Generational Estate Planning | Usually No | Yes (Wills, Nominations, Trust Maps) |
| Legal Fiduciary Obligation | No | Yes (Legally Bound to Put Clients First) |
A dedicated fiduciary advisor operates on a clear, flat fee paid directly by you. This framework guarantees absolute transparency, ensuring your wealth management strategy covers your complete financial life—including automated rebalancing protocols, strategic risk adjustments, cash flow management, and multi-generational succession trust architecture.
What If You Never Switch? The Cost of Inaction
To fully understand the long-term cost of inaction, let us model an ambitious 30-year career horizon. Suppose a professional begins investing at Age 30 and continues steadily until Age 60, executing a significant 50,000 monthly SIP. Assuming our standard net equity returns of 11.2% for the Direct pathway versus 10.4% for the regular commission track, look at where the balance sheets sit at the retirement threshold:
- The Terminal Value of Direct Fiduciary Accounts: 15.15 Crores
- The Terminal Value of Regular Commission Accounts: 12.60 Crores
- The Generational Cost of Inaction: 2.55 Crores
The real cost of remaining trapped in regular plans is not simply what you pay out each month today. The true cost is the massive chunk of future wealth you never get to own. That 2.55 Crores is capital that is systematically drained away from your personal financial independence, your early retirement freedom, or the legacy you leave for your children, simply to fund an outdated transactional distribution network.
Uncovering Leakages Beyond Mutual Funds
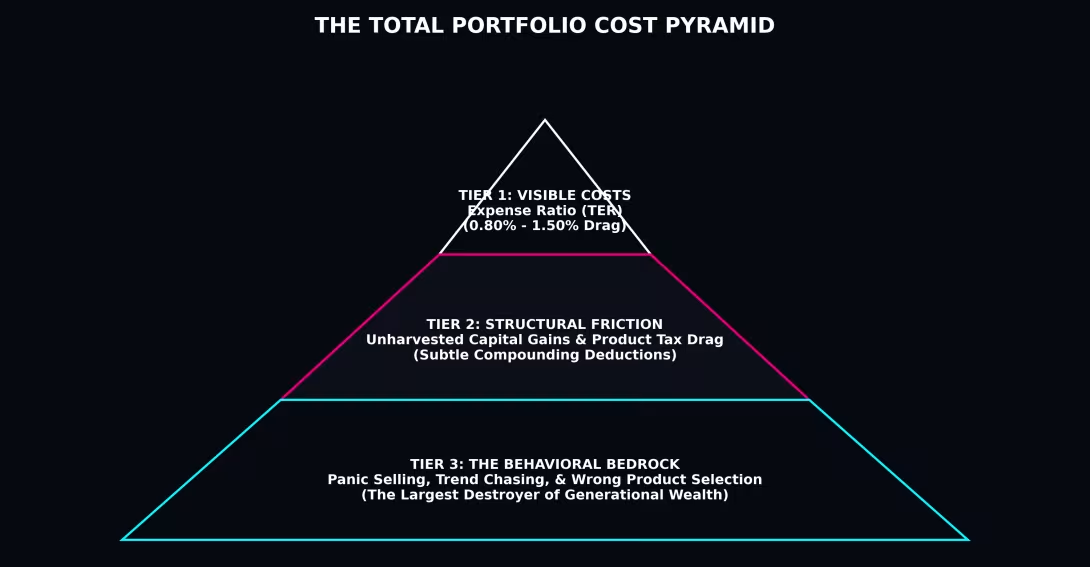
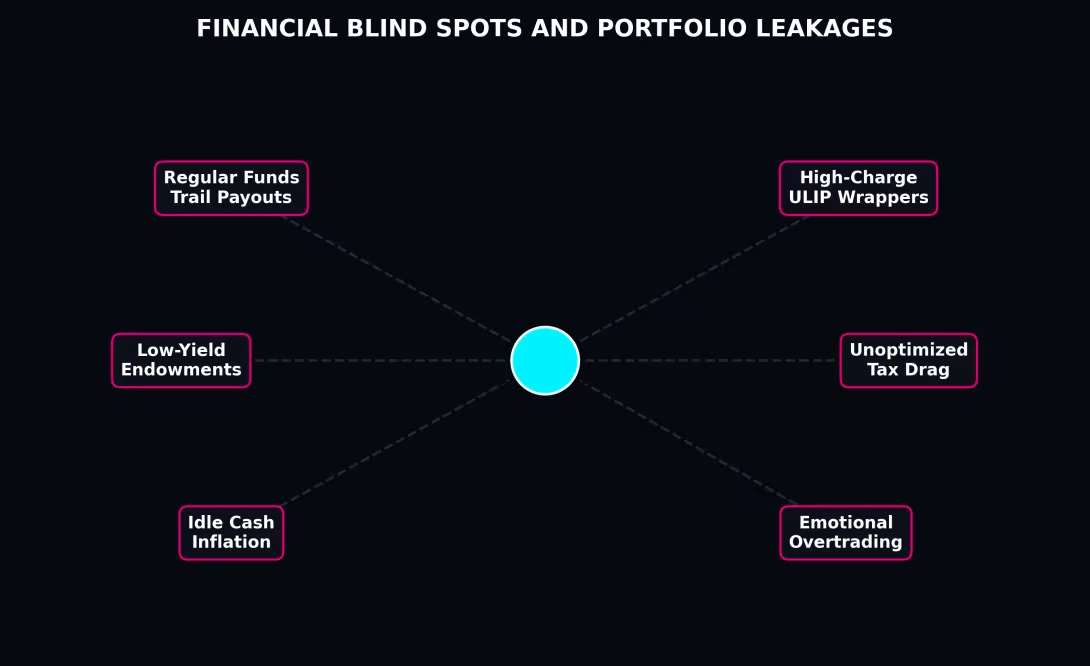
Mutual fund expense ratios are often just the visible tip of the personal finance cost pyramid. Many family portfolios carry much larger, hidden structural leakages that drain wealth far faster than a standard regular plan:
- Legacy Endowment Policies: Traditional insurance-cum-investment bundles that frequently lock up capital for decades while delivering low, non-inflation-capped returns of 4% to 6%.
- Unit Linked Insurance Plans (ULIPs): Complicated financial wrappers that carry heavy front-loaded mortality charges, high premium allocation fees, and restrictive surrender rules that disrupt long-term compounding.
- Excess Idle Cash Reserves: Keeping large chunks of capital parked in low-yield savings accounts or static fixed deposits, exposing your liquid reserves to purchasing power erosion from real-world inflation.
- Tax-Inefficient Asset Placement: Failing to actively harvest long-term capital gains or positioning high-tax yield assets outside of tax-advantaged accounts, resulting in unnecessary tax drag on your returns.
- The Behavioral Gap: The most expensive portfolio cost of all. Panic selling during market corrections, performance-chasing at cyclical peaks, and frequent portfolio churning driven by media noise routinely cost investors far more than standard management fees. A trusted advisor serves as an emotional circuit breaker, protecting your capital from impulsive behavioral mistakes.
The Institutional Compliance and Investor Protection Ecosystem
Moving past standard product sales into a regulated SEBI RIA partnership grants you access to an institutional compliance and investor protection framework designed by the Securities and Exchange Board of India. Registered advisers must operate under strict regulatory oversight, which includes mandatory formal risk profiling, documented written suitability records, absolute fee disclosure transparency, and annual compliance audits.
Furthermore, this framework provides investors with access to formal, regulated grievance escalation channels to ensure complete accountability:
- Internal Grievance Resolution: Registered advisers must maintain a formal internal review system to log and address client operational concerns within set regulatory timelines.
- The SEBI SCORES Network: If an internal dispute is not resolved satisfactorily, investors can escalate their concerns directly to the SEBI Complaints Redress System (SCORES) for mandatory regulatory review.
- The Online Dispute Resolution (ODR) Platform: An efficient, completely digital arbitration gateway designed to resolve complex financial advisory disputes fairly without the prolonged delays of traditional legal systems.
A Practical Decision Checklist for Savvy Investors
To audit your active portfolio layout and protect your capital from hidden friction, take a moment to ask these seven foundational questions:
- Are my current mutual fund holdings deployed through direct plans or commission-heavy regular tracks?
- What is the total aggregate annual cost drag of my portfolio, including all embedded insurance and management fees?
- What specific, tangible value am I receiving from my broker or bank in exchange for the ongoing trail commissions deducted from my assets?
- Are my asset allocation weights systematically tied to my real-world life goals, or are they built around fragmented product sales pitches?
- Do I have a structured, automated rebalancing routine to protect my capital when markets hit extreme valuations?
- Who is completely accountable for the objective performance and suitability of my financial advice?
- How will my current cash flow strategy and asset protection walls behave if the equity markets hit a sudden 30% correction?
Moving past legacy product distribution networks is a vital step toward reclaiming control over your financial timeline. Shifting your capital into direct plans and partnering with an independent, fee-only fiduciary adviser ensures your portfolio is managed with total integrity, absolute cost efficiency, and zero conflict of interest. Identifying portfolio leakages requires transparent data, not a product sales pitch. We invite you to explore our comprehensive Get Started Onboarding Roadmap to learn about our transparent processes, or connect with our secure gateway to arrange your private, zero-obligation portfolio diagnostic session today.
Skip commission-driven sales pitches and align your capital with a pure fee-only fiduciary adviser.